Behind every flashy “new planet discovered” headline, there’s a much quieter operation running in the background: an endless, unglamorous job of hoarding data.
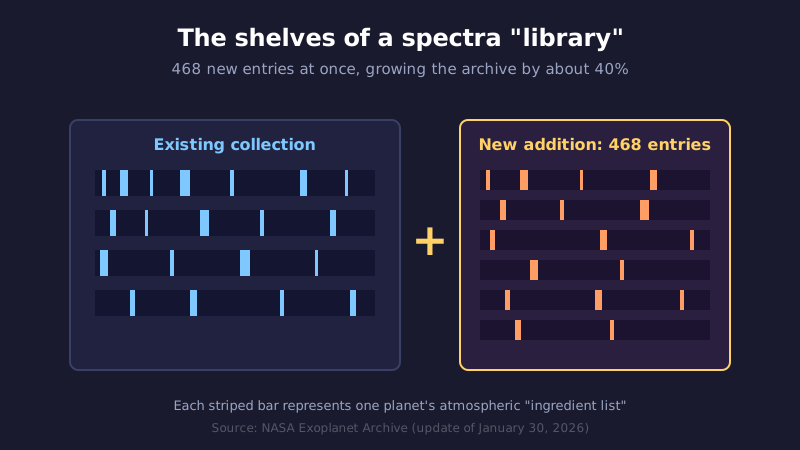
In January 2026, NASA’s public Exoplanet Archive added 468 atmospheric spectra in a single update. That’s not a typo — one update pushed the archive’s total holdings up by roughly 40 percent. No new planets were found. Nothing was freshly observed. Existing data just got gathered up, standardized, and reshelved. That’s the whole story.
Except that “whole story” happens to be one of the real engines driving exoplanet science forward.
Wait, what does a “spectrum” actually tell you about a planet?
The word “spectrum” doesn’t mean much on its own, so let’s find something more familiar to compare it to.
The closest analogy is the nutrition label on the back of a food package. You don’t need to open the box to know how much protein or sugar is inside — the label just tells you. An exoplanet’s spectrum works almost exactly the same way. You never travel to the planet itself, but the spectrum tells you which gases are mixed into its atmosphere. It’s an ingredient label for a world hundreds of light-years away.
So how do you read the contents of something that far away without ever opening it?
The trick is light. When a planet passes in front of its host star — the star it orbits — a sliver of starlight grazes through the planet’s atmosphere on its way to us. Molecules in that atmosphere absorb only certain colors, or wavelengths, of light. Those colors then go missing from the light that reaches our telescopes, leaving dark lines etched into the spectrum.
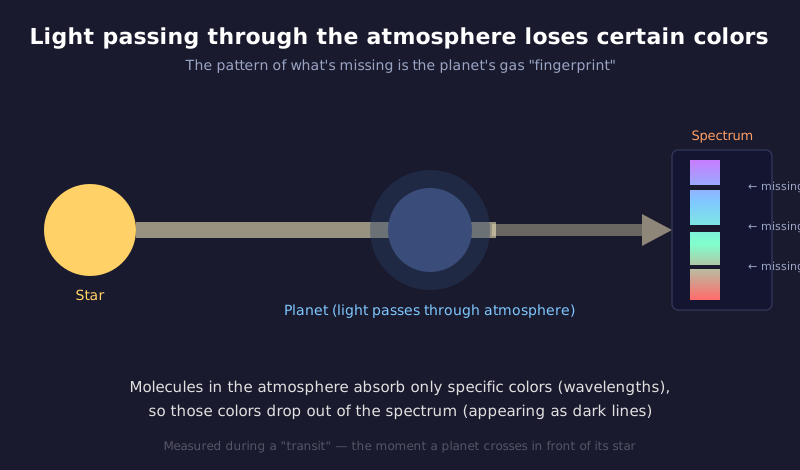
Read the position of those missing colors, and you can tell water vapor from carbon dioxide from methane — each gas leaves its own fingerprint. I’ll admit it: for years I pictured a spectrum as basically a pretty rainbow coming off a star. Turns out the interesting part is exactly what’s not there.
And the missing bit is vanishingly small. Light that passes through a planet’s atmosphere is a mere sliver compared to the star’s total output. Turning that faint signal into a readable spectrum means pointing a telescope at the same transit over and over, patiently stacking weak measurements until a pattern emerges. Producing a single usable “ingredient label” is, frankly, a massive amount of work.
To get a sense of just how delicate this is: imagine standing on the ground and detecting that a mosquito’s wing, crossing in front of a distant streetlight, shifted the streetlight’s color by a hair. That’s roughly the scale of the challenge. A planet is hundreds of times dimmer than its star, and its atmosphere is a thinner sliver still. You need many transits, stacked on top of each other, before a single striped pattern finally comes into focus. Which is exactly why nobody wants to throw away a spectrum once it’s been captured.
Capturing data isn’t enough — if it’s inconsistent, you can’t compare it
Telescopes around the world capture spectra like this every single day. The James Webb Space Telescope (JWST). The Hubble Space Telescope. Various ground-based observatories, too.
But there’s an unglamorous problem lurking here. Different instruments, different teams, wildly different recording formats. Planet names get written differently. Wavelength units differ. Observation dates get logged in different orders. A human reader might shrug and say “yeah, that’s basically the same thing” — but try to compare hundreds of these files by machine, and that inconsistency becomes a wall. Which is understandable, honestly. Each team just needs their data formatted well enough for their own paper. Nobody’s thinking ahead to the day some stranger tries to merge it with everyone else’s.
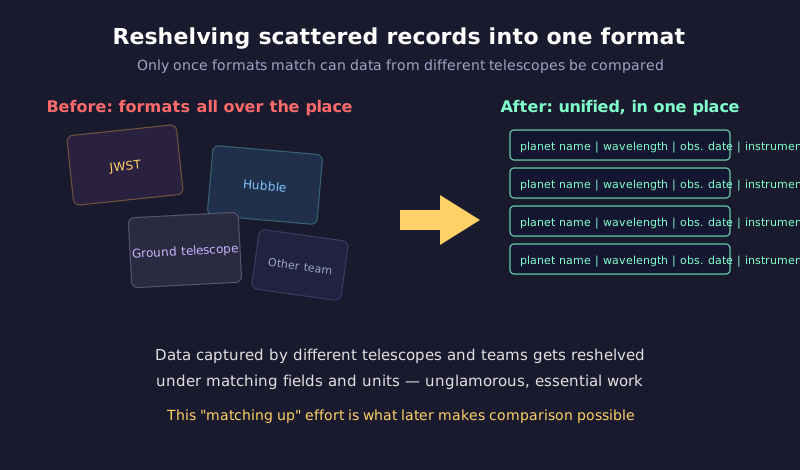
So what the archive actually does is take all these spectra and reshelve them under one consistent format. Same fields for planet name, wavelength, instrument used — everything slotted into its proper place. There’s essentially zero glamour to this work. It’s a lot like a librarian pasting matching spine labels on every book in the building.
The archive maintains a dedicated catalog of atmospheric spectra and keeps adding new entries to it. And the whole thing is free for anyone to browse or download. No single lab hoards this data for itself — researchers everywhere can pull from the same shelf. That’s where the real payoff shows up.
But skip this label-pasting step, and you pay for it later. Which brings us to the next part of the story.
What one spectrum can’t tell you, hundreds of them can
Picture yourself as a researcher holding exactly one planet’s spectrum.
About the best you can say is “this planet’s atmosphere probably contains methane.” That’s a real finding — but it’s where the story ends. Now imagine having hundreds of spectra, all formatted the same way. Suddenly the conversation changes. You can line planets up by size. By temperature. You can make comparisons across the whole population at once.
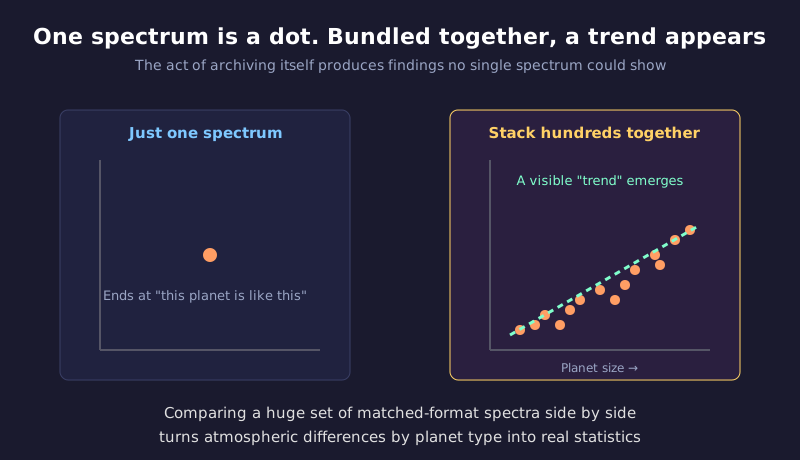
And that’s when a pattern invisible in any single spectrum starts to surface: “planets around this size tend to have this kind of atmosphere.” Individual dots, once you have enough of them, become a line.
The comparisons don’t even need to come from the same era. A single spectrum captured by a ground telescope ten years ago can sit shoulder to shoulder with one JWST took last year — same shelf, same yardstick, decades and instruments apart. That’s a vantage point you simply cannot get by only chasing whatever’s being observed right now.
This, honestly, is my favorite part of the whole story: the unglamorous act of hoarding data turns into a machine for generating new discoveries. So when 468 spectra land at once and the collection swells by 40 percent, that’s not just a bigger number. It means the pool of things you can compare against just exploded.
Think of it like your neighborhood library’s collection ballooning by 40 percent overnight. It’s not just that you have more books to read — it’s that the pleasure of comparing books against each other jumps dramatically. And every single spectrum added to that shelf represents someone, somewhere, who spent precious telescope time capturing it. Scattered across different papers and formats, those observations would have sat unused. Standardized and shelved together, they suddenly become usable for the next big question. Buried in that new batch are combinations nobody has ever set side by side before — fresh comparison partners, delivered to the shelf all at once.
The data being collected isn’t just the famous planets
The batch of spectra added this time includes JWST observations. But what’s getting archived isn’t limited to splashy new discoveries.
A recent update, for instance, added Hubble Space Telescope spectra for all six planets in the TRAPPIST-1 system — the star system famous for hosting seven roughly Earth-sized worlds. Another update folded in JWST transmission-spectroscopy data on the atmosphere of a planet smaller than Neptune, orbiting a star called TOI-1130.
In other words, the famous planets and the obscure small ones all land on the same shelf, no distinction made. An observation too minor to make headlines on its own becomes, once bundled with hundreds of others, a legitimate “volume” for comparison.
The payoff probably won’t show up right away. A few years from now, someone will decide “let’s line up every atmosphere we have for small, warm planets” — and they won’t need to start observing from scratch. The ingredient labels the whole world has already captured will already be sitting there, in matching format, ready to go. It’s an investment: stockpiling raw material for answers before anyone’s even asked the future’s questions.
While the headlines chase discoveries, the shelves quietly fill up
Exoplanet news usually shines its light on the moment of discovery — “might harbor life,” “Earth-like world found.” Fair enough. Those moments deserve the excitement.
But underneath all that, a quieter process runs continuously: gathering captured spectra, labeling them, reshelving them in matching format, all in a form anyone can access. The researcher who makes the next big discovery might well start by pulling a single volume off this shelf that’s been quietly filling for years.
Somewhere in the sky you’re looking at tonight, hundreds of light-years away, the ingredient label for some planet’s atmosphere is sitting on a server on Earth — one more spine added to the shelf, quietly, alongside all the others.